Which of the following graph correctly represents the plots of ${K_H}$ at 1 bar for gases in water versus temperature?
Options
A
B
C
D
✓ Correct! Well done.
✗ Incorrect. Try again or view the solution.
Solution
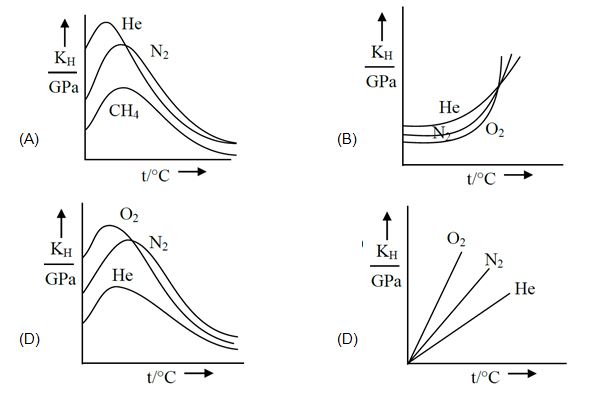
As temperature increases solubility first decrease then increase hence ${K_H}$ first increase than decrease also at moderate temperature ${K_H}$ value $He > {N_2}>C{H_4}$.
Hello 👋 Welcome to Competishun – India’s most trusted platform for JEE & NEET preparation. Need help with JEE / NEET courses, fees, batches, test series or free study material? Chat with us now 👇