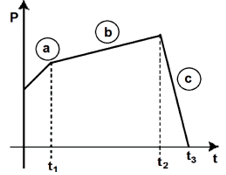
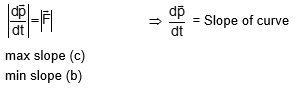
The figure represents the momentum time ( $p-t$ ) curve for a particle moving along an axis under the influence of the force. Identify the regions on the graph where the magnitude of the force is maximum and minimum respectively? If $\left(t_3-t_2\right)<t_1$.