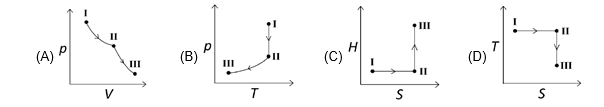
An ideal gas undergoes a reversible isothermal expansion from state 1 to state 11 followed by a reversible adiabatic expansion from state II to state III. The correct plot(s) representing the changes from state I to state III is(are)
(p: pressure, V: volume, T: temperature, H: enthalpy, S: entropy)
Hello 👋 Welcome to Competishun – India’s most trusted platform for JEE & NEET preparation. Need help with JEE / NEET courses, fees, batches, test series or free study material? Chat with us now 👇