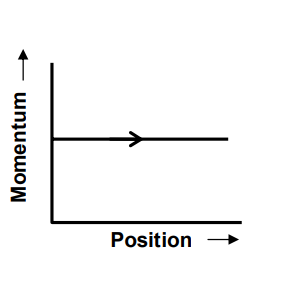
Phase space diagrams are useful tools in analyzing all kinds of dynamical problems. They are especially useful in studying the changes in motion as initial position and momenum are changed. Here we consider some simple dynamical systems in onedimension. For such systems, phase space is a plane in which position is plotted along horizontal axis and momentum is plotted along vertical axis. The phase space diagram is $x(t)$ vs. $p(t)$ curve in this plane. The arrow on the curve indicates the time flow. For example, the phase space diagram for a particle moving with constant velocity is a straight line as shown in the figure. We use the sign convention in which positon or momentum upwards (or to right) is positive and downwards (or to left) is negative.
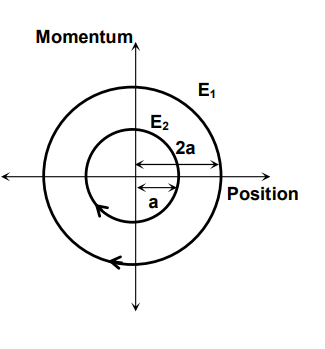
The phase space diagram for simple harmonic motion is a circle centered at the origin. In the figure, the two circles represent the same oscillator but for different initial conditions, and $\mathrm{E}_1$ and $\mathrm{E}_2$ are the total mechanical energies respectively. Then
Hello 👋 Welcome to Competishun – India’s most trusted platform for JEE & NEET preparation. Need help with JEE / NEET courses, fees, batches, test series or free study material? Chat with us now 👇