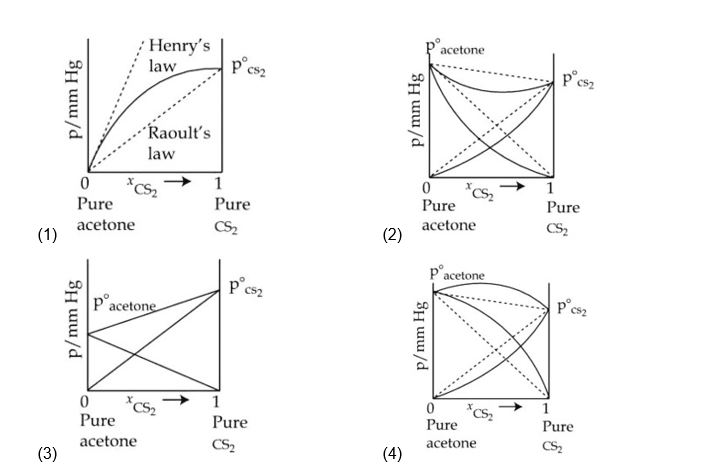
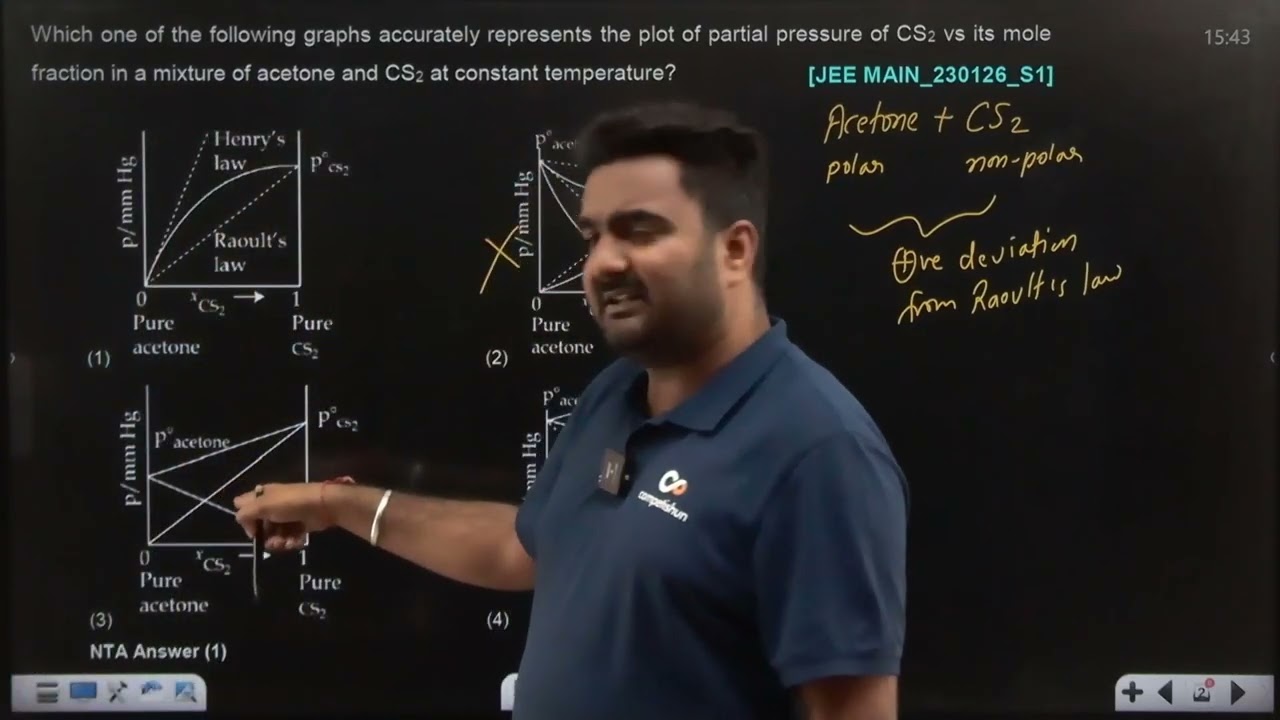
Which one of the following graphs accurately represents the plot of partial pressure of $\mathrm{CS}_2$ vs its mole fraction in a mixture of acetone and $\mathrm{CS}_2$ at constant temperature?
Hello 👋 Welcome to Competishun – India’s most trusted platform for JEE & NEET preparation. Need help with JEE / NEET courses, fees, batches, test series or free study material? Chat with us now 👇