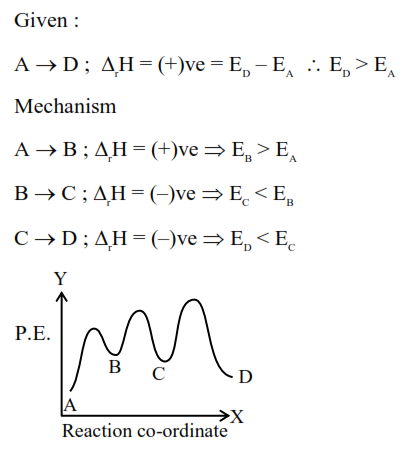
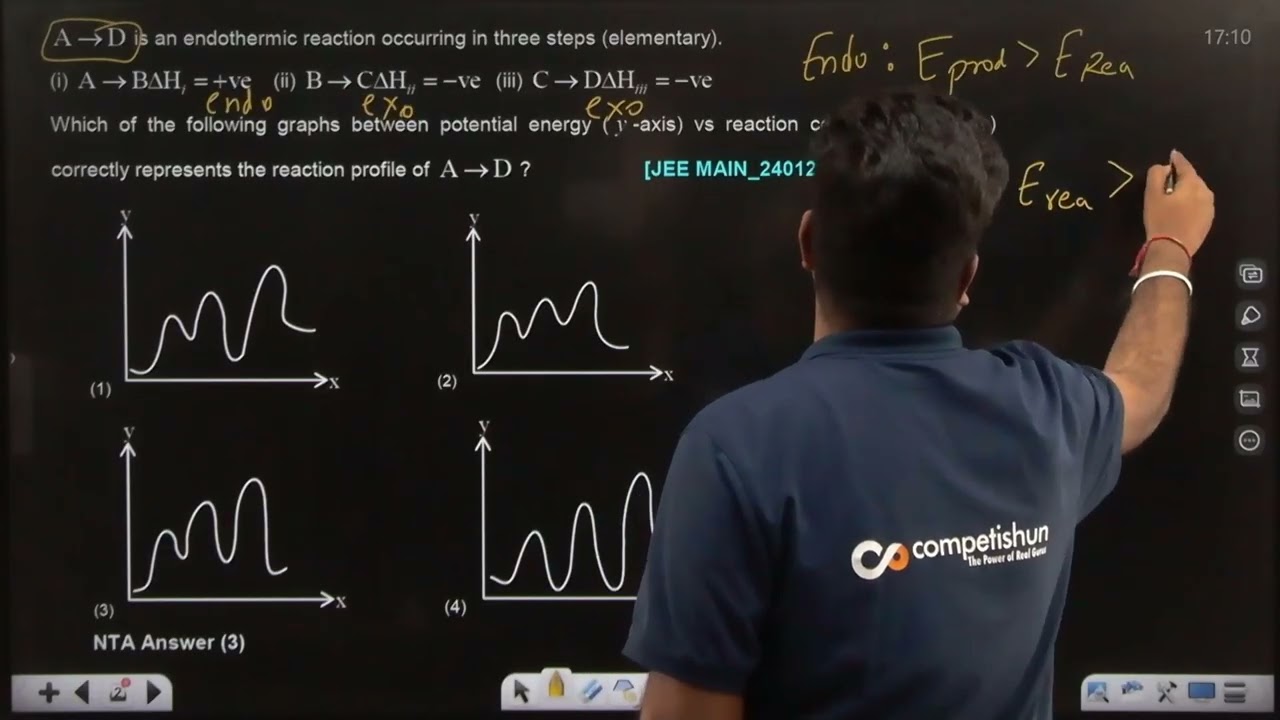
$\mathrm{A} \rightarrow \mathrm{D}$ is an endothermic reaction occurring in three steps (elementary).
(i) $\mathrm{A} \rightarrow \mathrm{B} \Delta \mathrm{H}_i=+\mathrm{ve}$
(ii) $\mathrm{B} \rightarrow \mathrm{C} \Delta \mathrm{H}_{i i}=-\mathrm{ve}$
(iii) $\mathrm{C} \rightarrow \mathrm{D} \Delta \mathrm{H}_{i i i}=-\mathrm{ve}$
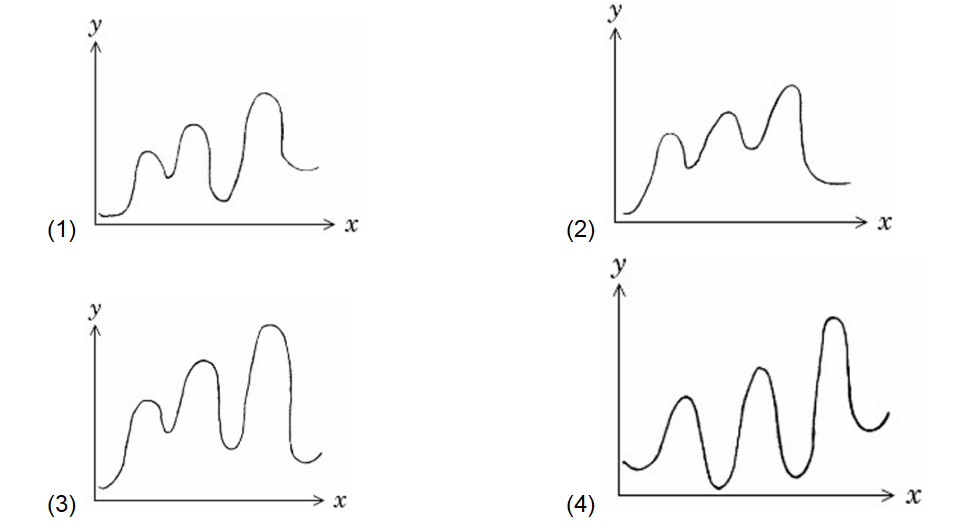
Which of the following graphs between potential energy ( $y$-axis) vs reaction coordinate ( x -axis) correctly represents the reaction profile of $\mathrm{A} \rightarrow \mathrm{D}$ ?