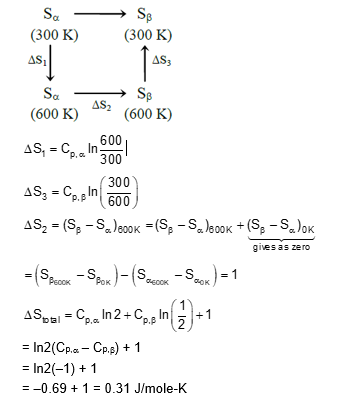
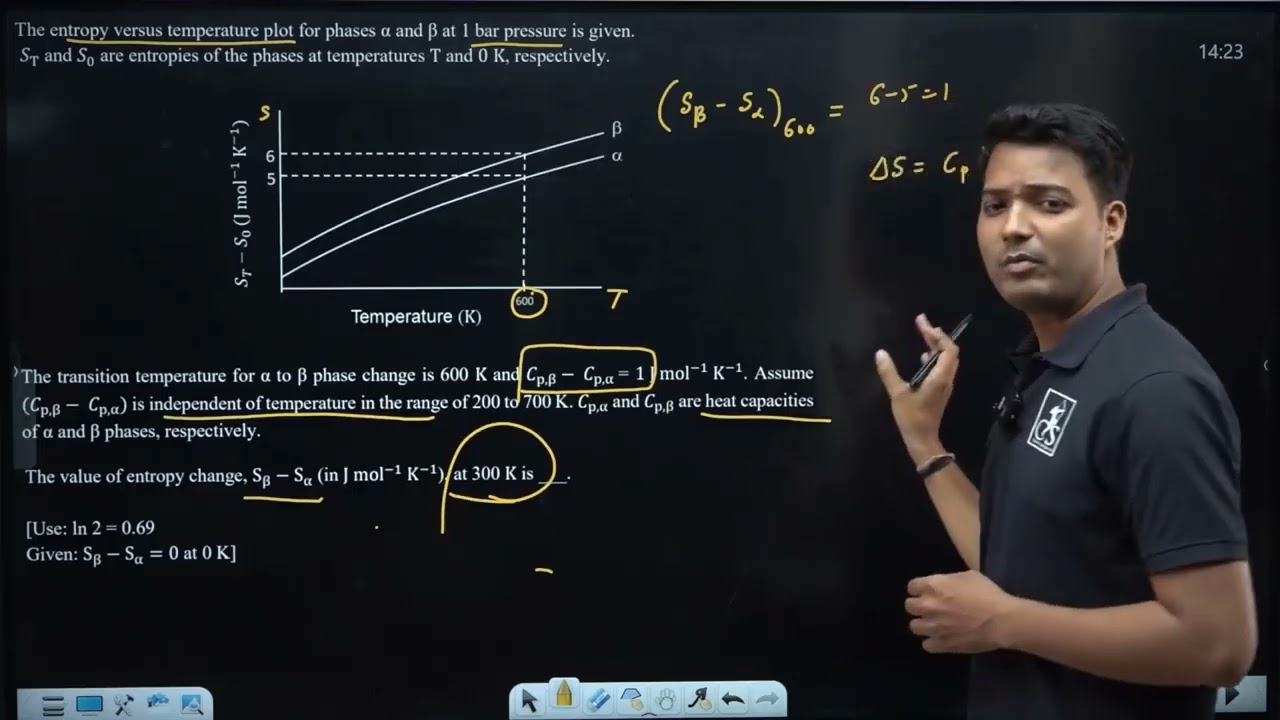
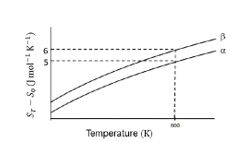
 The transition temperature for $\alpha$ to $\beta$ phase change is 600 K and $C_{\mathrm{p} . \beta}-C_{\mathrm{p} . \mathrm{q}}=1 \mathrm{~J} \mathrm{~mol}^{-1} \mathrm{~K}^{-1}$. Assume ( $C_{\mathrm{p} . \beta}$ $C_{\mathrm{p} . \mathrm{g}}$ ) is independent of temperature in the range of 200 to $700 \mathrm{~K} . C_{\mathrm{p} . \mathrm{q}}$ and $C_{\mathrm{p} . \beta}$ are heat capacities of $\alpha$ and $\beta$ phases, respectively.