Skip to content
Courses
Test Series
Books
Free Resources
Result
Contact Us
Courses
Test Series
JEE Solutions
NCERT PDF
Books
Free Resources
Gallery
Result
Blogs
Watch JEE/NEET Free Lectures
↗
Download Our App
↗
Follow Us
Login / Register
Back
Report
Report Issue
×
Wrong Answer
Typo Error
Image Issue
Not Clear
Other
JEE MAIN 2021
1-9-21 S2
Question
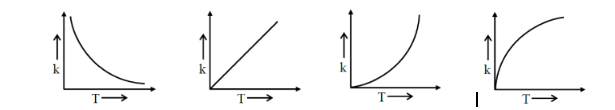
Which one of the following given graphs represents the variation of rate constant (k) with temperature (T) for an endothermic reaction ?
Options
A
B
C
D
✓ Correct! Well done.
✗ Incorrect. Try again or view the solution.
View Solution
Solution
By observation we get this plot during measurable temperatures
Question Tags
JEE Main
Physics
Easy
Start Preparing for JEE with Competishun
YouTube
Books
App
Tests
Scan the code
Powered by
Joinchat
Hello 👋 Welcome to Competishun – India’s most trusted platform for JEE & NEET preparation.
Need help with JEE / NEET courses, fees, batches, test series or free study material? Chat with us now 👇
Open Chat