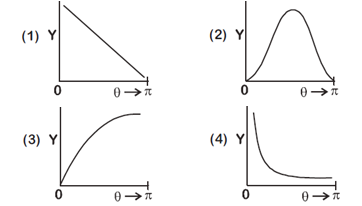
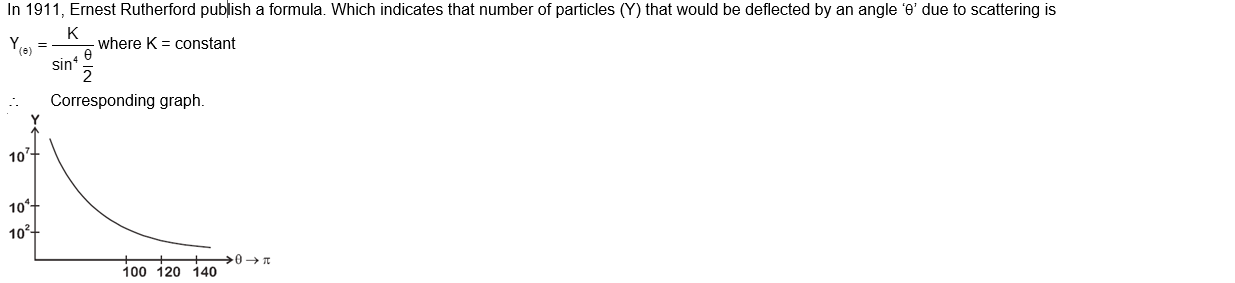
The graph which depicts the results of Rutherford gold foil experiment with $\alpha$-particle is
$\theta$ : Scattering angle
Y: Number of scattered $\alpha$-particles detected
(Plots are schematic and not to scale)
Hello 👋 Welcome to Competishun – India’s most trusted platform for JEE & NEET preparation. Need help with JEE / NEET courses, fees, batches, test series or free study material? Chat with us now 👇