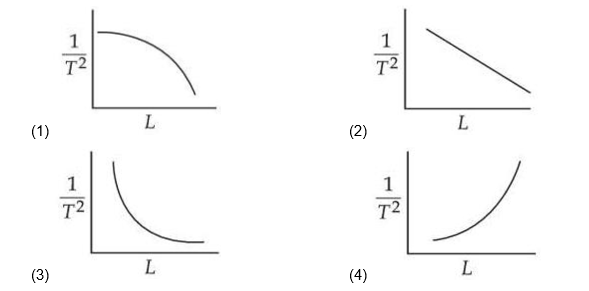
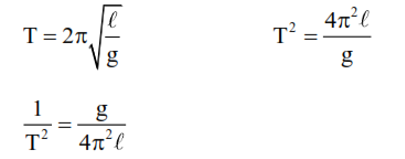
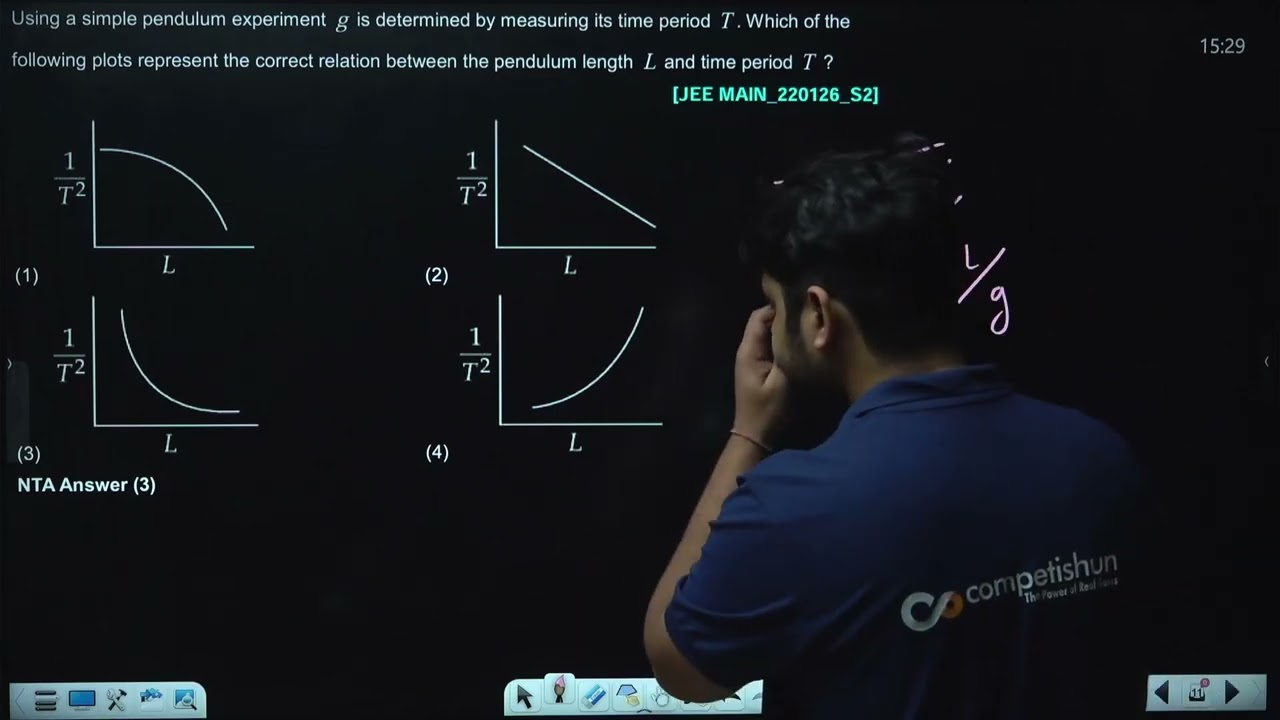
Using a simple pendulum experiment $g$ is determined by measuring its time period $T$. Which of the following plots represent the correct relation between the pendulum length $L$ and time period $T$ ?
Hello 👋 Welcome to Competishun – India’s most trusted platform for JEE & NEET preparation. Need help with JEE / NEET courses, fees, batches, test series or free study material? Chat with us now 👇