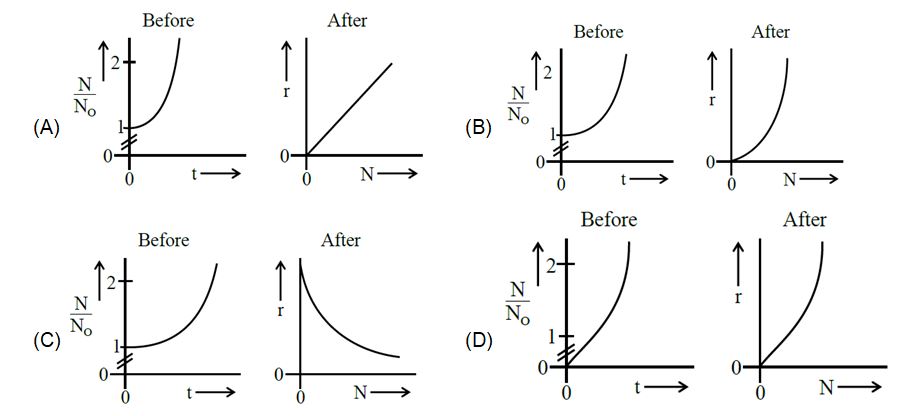
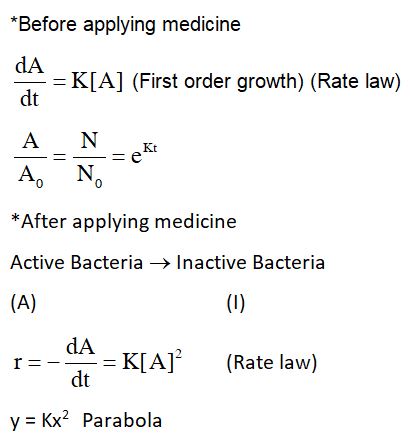
A person's wound was exposed to some bacteria and then bacterial growth started to happen at the same place. The wound was later treated with some antibacterial medicine and the rate of bacterial decay(r) was found to be proportional with the square of the existing number of bacteria at any instance. Which of the following set of graphs correctly represents the 'before' and 'after' situation of the application of the medicine?
[Given: N = No. of bacteria, t = time, bacterial growth follows 1st order kinetics.]
Hello 👋 Welcome to Competishun – India’s most trusted platform for JEE & NEET preparation. Need help with JEE / NEET courses, fees, batches, test series or free study material? Chat with us now 👇