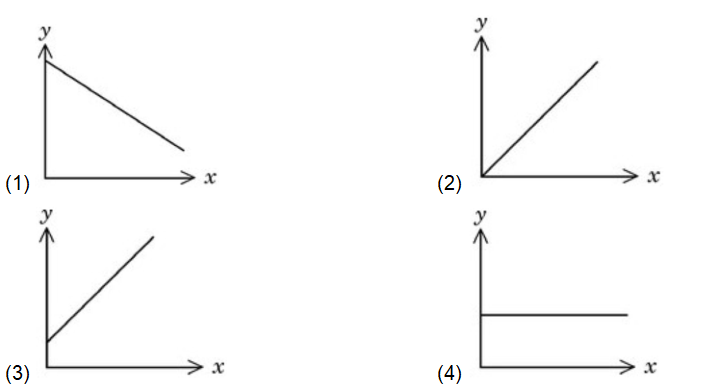
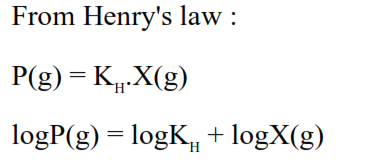
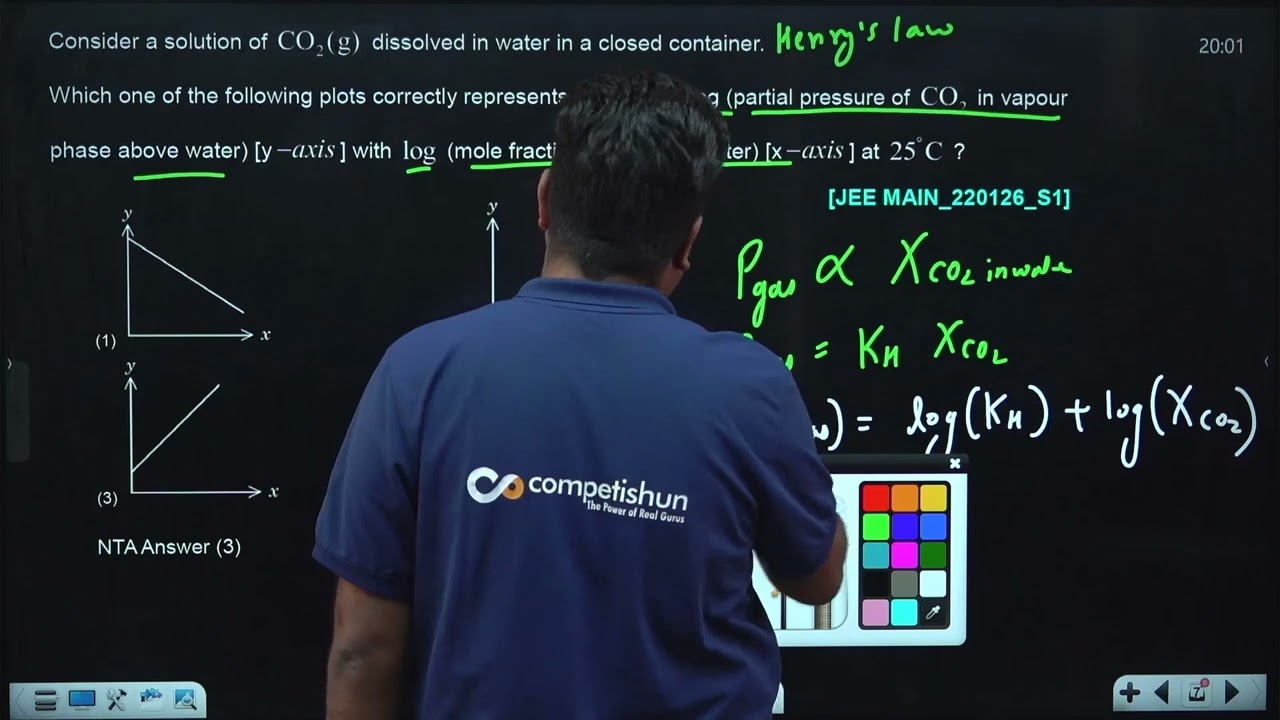
Consider a solution of $\mathrm{CO}_2(\mathrm{~g})$ dissolved in water in a closed container.
Which one of the following plots correctly represents variation of log (partial pressure of $\mathrm{CO}_2$ in vapour phase above water) $[y$-axis $]$ with $\log$ (mole fraction of $\mathrm{CO}_2$ in water) $[x$-axis $]$ at $25^{\circ} \mathrm{C}$ ?
Hello 👋 Welcome to Competishun – India’s most trusted platform for JEE & NEET preparation. Need help with JEE / NEET courses, fees, batches, test series or free study material? Chat with us now 👇