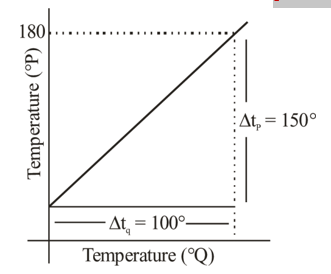
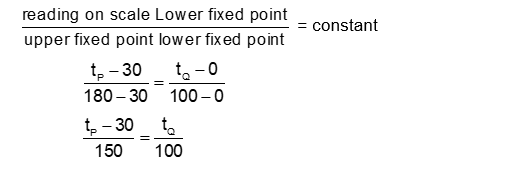
The graph between two temperature scales P and Q is shown in the figure. Between upper fixed point and lower fixed point there are 150 equal divisions of scale P and 100 divisions on scale Q. The relationship for conversion between the two scales is given by
Hello 👋 Welcome to Competishun – India’s most trusted platform for JEE & NEET preparation. Need help with JEE / NEET courses, fees, batches, test series or free study material? Chat with us now 👇