Skip to content
Competishun Header
Home
Courses
Test Series
Books
Free Resources
Result
Contact Us
NIOS
Free Resources
Courses
Test Series
JEE Solutions
JEE Tools & Predictor
NCERT PDF
Books
Gallery
Result
Blogs
Watch JEE Free Lectures
↗
Download Our App
↗
Follow Us
Login / Register
Back
Report
Report Issue
×
Wrong Answer
Typo Error
Image Issue
Not Clear
Other
JEE MAIN 2025
28-01-2025 SHIFT-1
Question
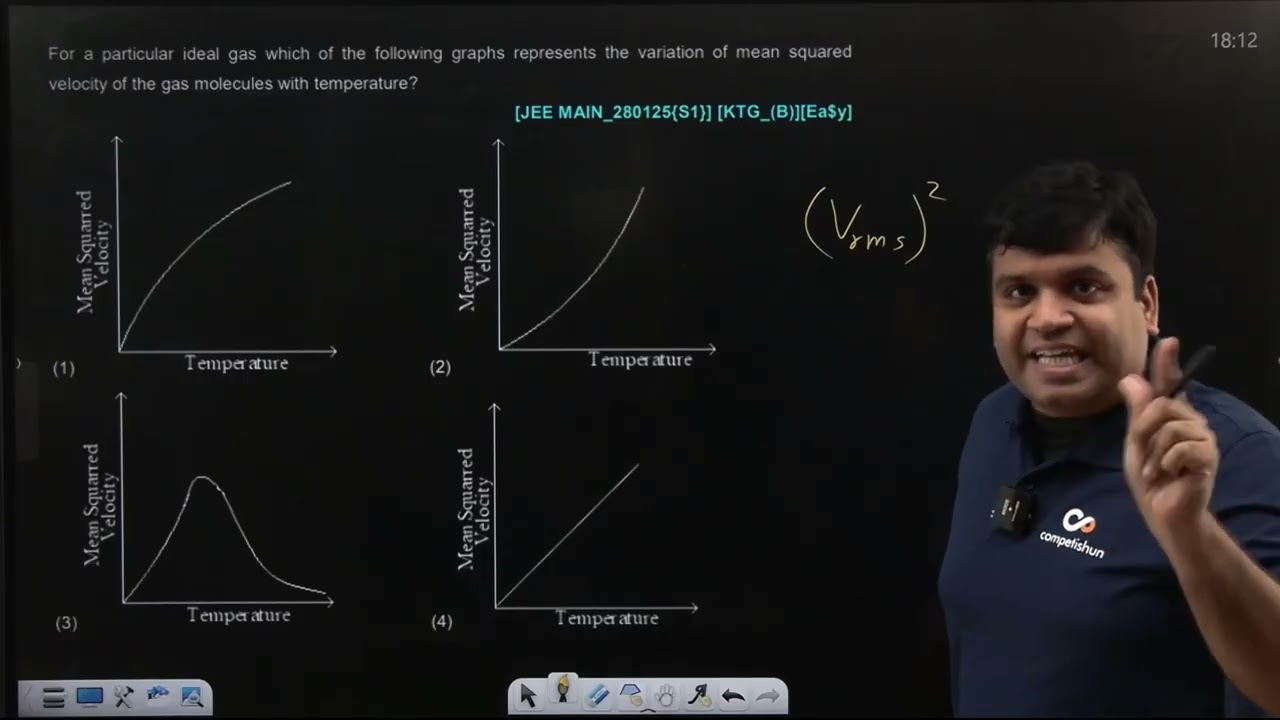
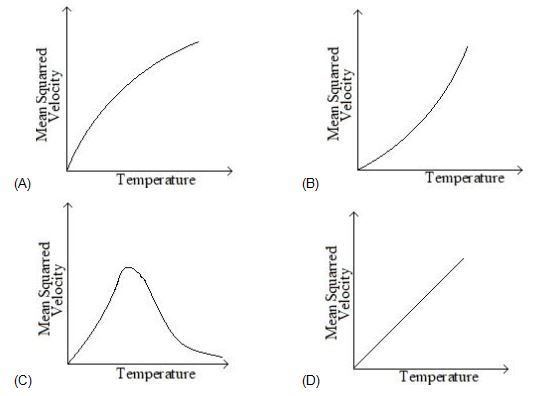
For a particular ideal gas which of the following graphs represents the variation of mean squared velocity of the gas molecules with temperature?
Options
A
B
C
D
✓ Correct! Well done.
✗ Incorrect. Try again or view the solution.
View Solution
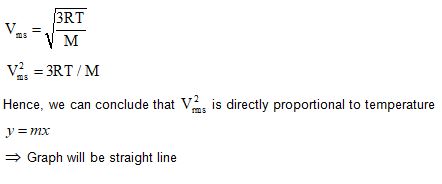
Solution
Question Tags
JEE Main
Physics
Easy
Start Preparing for JEE with Competishun
YouTube
Books
App
Tests
Video Solution
BY competishun
Watch Solution
YouTube
Share this solution:
Share on WhatsApp
Filters
0
Subject
▾
Exam
▾
JEE Main
JEE Advance
Difficulty
▾
Easy
Medium
Hard
Year
▾
✕ Clear All
Showing
18
questions
Q
JEE MAIN 2026
2026
Given below are two statements
Statement I: $\mathrm{H}_2 \mathrm{O}$ molecules move from the chamber 1 to chamber 2 .
Statement II:...
JEE Main
Chemistry
Medium
View Solution
→
Q
JEE MAIN 2021
2021
Which of the following molecules does not show stereo isomerism ?
JEE Main
Chemistry
Easy
View Solution
→
Q
JEE MAIN 2021
2021
Given below are two statements :
Statement-I : α and β forms of sulphur can change reversibly between themselves with...
JEE Main
Chemistry
Easy
View Solution
→
Q
JEE MAIN 2021
2021
Which one of the following statements is not true about enzymes ?
JEE Main
Chemistry
Easy
View Solution
→
Q
JEE MAIN 2021
2021
The solubility product of $\mathrm{Pbl}_2$ is $8.0 \times 10^{-9}$. The solubility of lead iodide in 0.1 molar solution of lead...
JEE Main
Chemistry
Hard
View Solution
→
Q
JEE MAIN 2022
2022
In Carius method of estimation of halogen. 0.45 g of an organic compound gave 0.36 g of AgBr. Find out...
JEE Main
Chemistry
Easy
View Solution
→
Q
JEE MAIN 2023
2023
The number of units, which are used to express concentration of solutions from the following is _______.
Mass percent,...
JEE Main
Chemistry
Easy
View Solution
→
Q
JEE MAIN 2022
2022
250 g solution of D-glucose in water contains 10.8% of carbon by weight. The molality of the solution is nearest...
JEE Main
Chemistry
Hard
View Solution
→
Q
JEE MAIN 2019
2019
A compound ' $X$ ' on treatment with $\mathrm{Br}_2 / \mathrm{NaOH}$, provided $\mathrm{C}_3 \mathrm{H}_9 \mathrm{~N}$, which gives positive carbylamine test....
JEE Main
Chemistry
Medium
View Solution
→
Q
JEE MAIN 2023
2023
In the following reaction, 'A' is
JEE Main
Chemistry
Medium
View Solution
→
Q
JEE MAIN 2021
2021
Which one of the following reactions does not occur ?
JEE Main
Chemistry
Easy
View Solution
→
Q
JEE MAIN 2021
2021
The major products A and B formed in the following reaction sequence are :
JEE Main
Chemistry
Easy
View Solution
→
Q
JEE MAIN 2021
2021
Correct statement about the given chemical reaction is :
JEE Main
Chemistry
Easy
View Solution
→
Q
JEE MAIN 2021
2021
Carbylamine test is used to detect the presence of primary amino group in an organic compound. Which of the following...
JEE Main
Chemistry
Easy
View Solution
→
Q
JEE-MAIN 2020
2020
Three isomers A. B and C (mol. formula $\mathrm{C}_2 \mathrm{H}_7, \mathrm{~N}$ ) give the following results
JEE Main
Chemistry
Easy
View Solution
→
Q
JEE MAIN 2021
2021
In the chemical reactions given above A and B respectively are :
JEE Main
Chemistry
Easy
View Solution
→
Q
JEE MAIN 2019
2019
Benzene diazonium chloride on reaction with aniline in the presence of dilute hydrochloric acid gives :
JEE Main
Chemistry
Easy
View Solution
→
Q
JEE MAIN 2022
2022
Stability of $\alpha$ - Helix structure of proteins depends upon
JEE Main
Chemistry
Easy
View Solution
→
Load More Questions
Scan the code
WhatsApp
Hello 👋 Welcome to Competishun – India’s most trusted platform for JEE & NEET preparation.
Need help with JEE / NEET courses, fees, batches, test series or free study material? Chat with us now 👇
Open Chat
Powered by
Joinchat