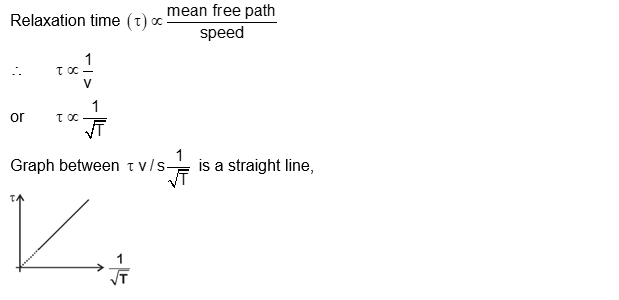
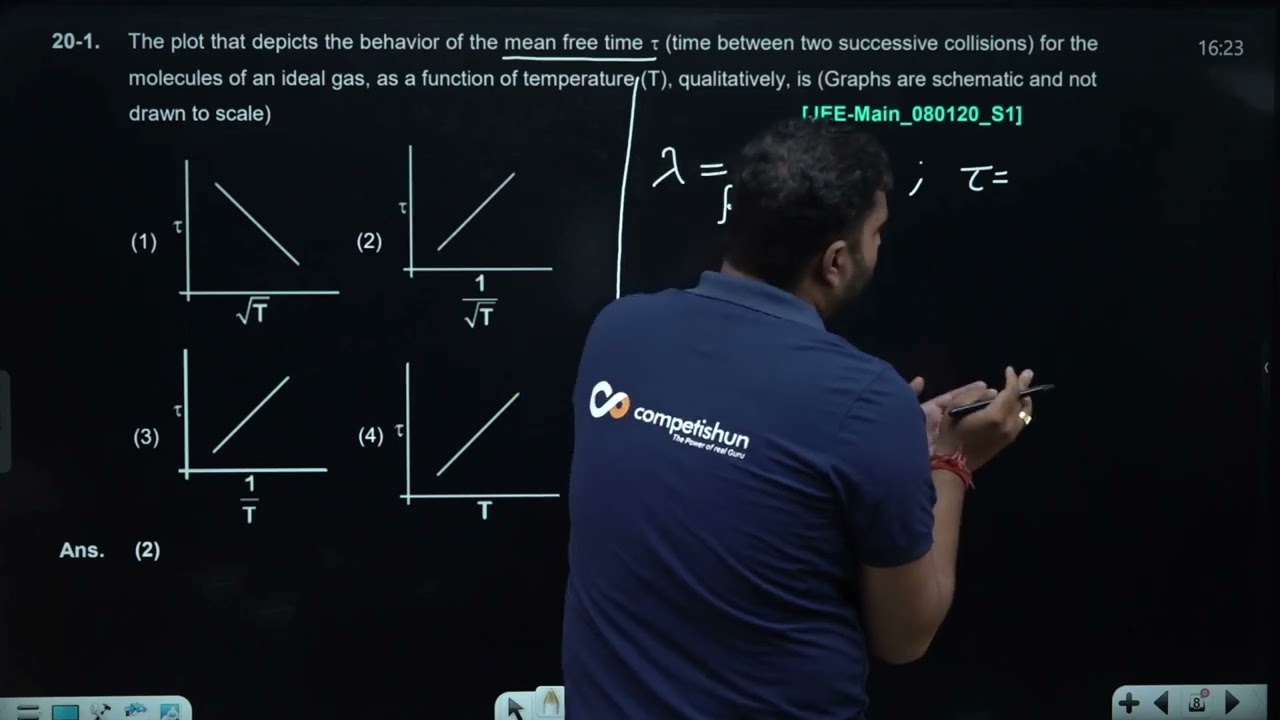
The plot that depicts the behavior of the mean free time $\tau$ (time between two successive collisions) for the molecules of an ideal gas, as a function of temperature (T), qualitatively, is (Graphs are schematic and not drawn to scale)
Hello 👋 Welcome to Competishun – India’s most trusted platform for JEE & NEET preparation. Need help with JEE / NEET courses, fees, batches, test series or free study material? Chat with us now 👇