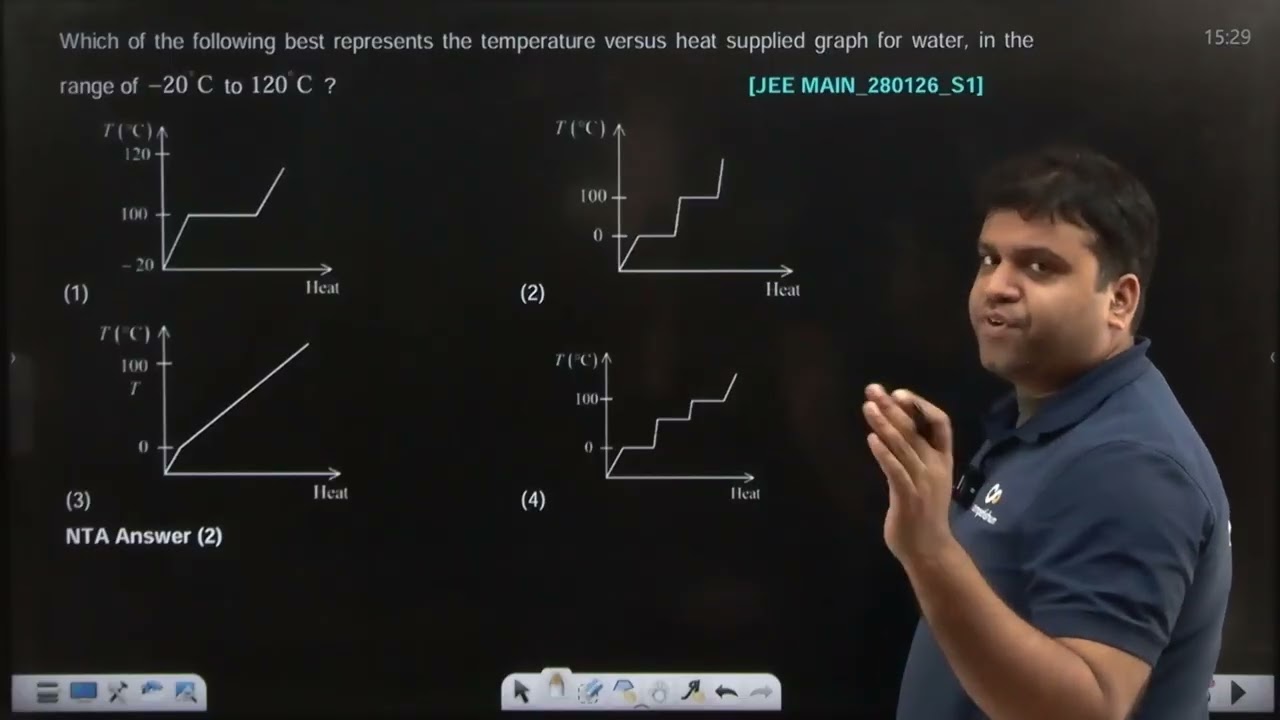
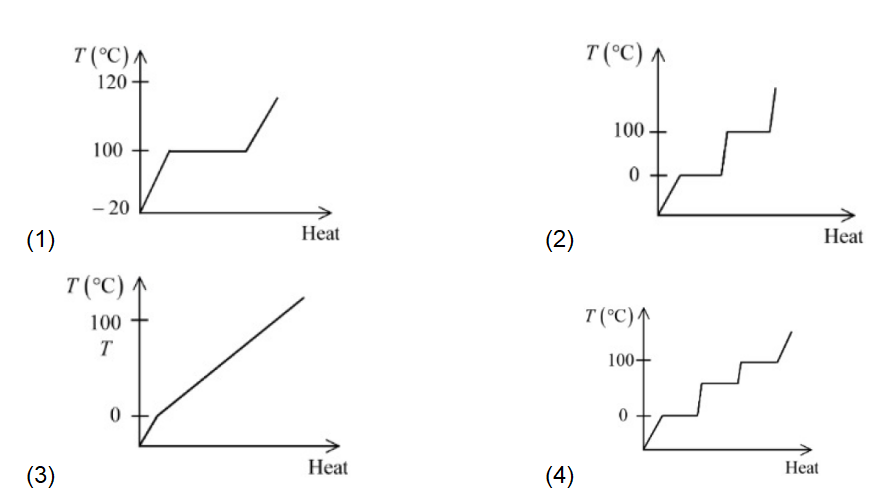
Which of the following best represents the temperature versus heat supplied graph for water, in the range of $-20^{\circ} \mathrm{C}$ to $120^{\circ} \mathrm{C}$ ?
Hello 👋 Welcome to Competishun – India’s most trusted platform for JEE & NEET preparation. Need help with JEE / NEET courses, fees, batches, test series or free study material? Chat with us now 👇